Generate candidates for different thresholds (t). A candidate consists of a disjoint collection of leaves and internal branches, that collectively cover all leaves in the tree, and represents a specific aggregation pattern along the tree.
Usage
getCand(
  tree,
  t = NULL,
  score_data,
  node_column,
  p_column,
  sign_column,
  threshold = 0.05,
  pct_na = 0.5,
  message = FALSE
)
Arguments
- tree
A
phyloobject.- t
A vector of threshold values used to search for candidates, in the range [0, 1]. The default (
NULL) uses a sequencec(seq(0, 0.04, by = 0.01), seq(0.05, 1, by = 0.05))- score_data
A
data.frameincluding at least one column with node IDs (specified with thenode_columnargument), one column with p-values (specified with thep_columnargument) and one column with directions of change (specified with thesign_columnargument).- node_column
The name of the column of
score_datathat contains the node information.- p_column
The name of the column of
score_datathat contains p-values for nodes.- sign_column
The name of the column of
score_datathat contains the direction of change (e.g., the log-fold change). Only the sign of this column will be used.- threshold
Numeric scalar; any internal node where the value of the p-value column is above this value will not be returned. The default is 0.05. The aim of this threshold is to avoid arbitrarily picking up internal nodes without true signal.
- pct_na
Numeric scalar. In order for an internal node to be eligible for selection, more than
pct_naof its direct child nodes must have a valid (i.e., non-missing) value in thep_columncolumn. Hence, increasing this number implies a more strict selection (in terms of presence of explicit values).- message
A logical scalar, indicating whether progress messages should be printed to the console.
Value
A list with two elements: candidate_list and
score_data. condidate_list is a list of candidates obtained
for the different thresholds. score_data is a data.frame
that includes columns from the input score_data and additional
columns with q-scores for different thresholds.
Examples
suppressPackageStartupMessages({
library(TreeSummarizedExperiment)
library(ggtree)
})
data(tinyTree)
ggtree(tinyTree, branch.length = "none") +
geom_text2(aes(label = node)) +
geom_hilight(node = 13, fill = "blue", alpha = 0.3) +
geom_hilight(node = 18, fill = "orange", alpha = 0.3)
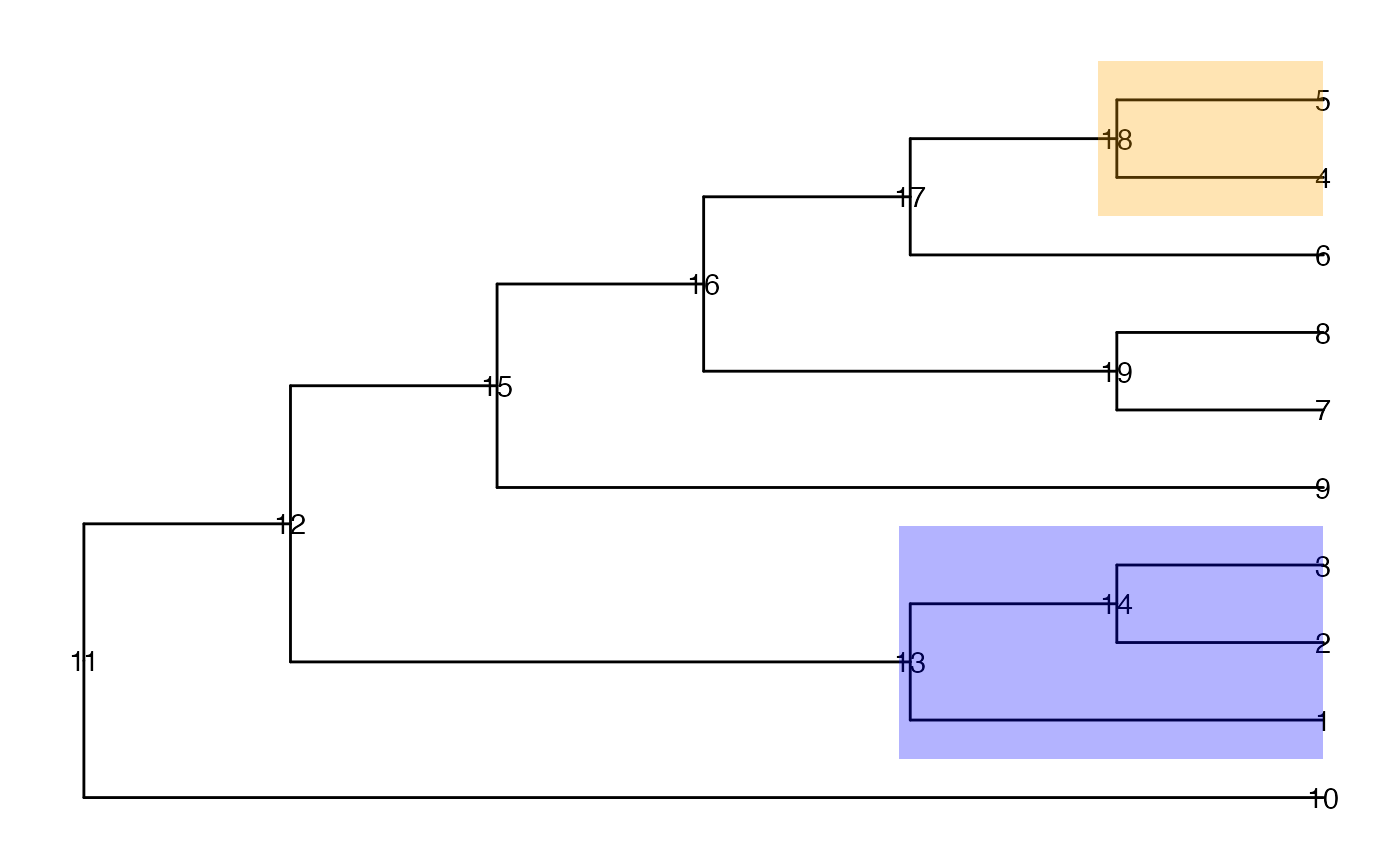 ## Simulate p-values and directions of change for nodes
## (Nodes 1, 2, 3, 4, 5, 13, 14, 18 have a true signal)
set.seed(1)
pv <- runif(19, 0, 1)
pv[c(seq_len(5), 13, 14, 18)] <- runif(8, 0, 0.001)
fc <- sample(c(-1, 1), 19, replace = TRUE)
fc[c(seq_len(3), 13, 14)] <- 1
fc[c(4, 5, 18)] <- -1
df <- data.frame(node = seq_len(19),
pvalue = pv,
logFoldChange = fc)
ll <- getCand(tree = tinyTree, score_data = df,
t = c(0.01, 0.05, 0.1, 0.25, 0.75),
node_column = "node", p_column = "pvalue",
sign_column = "logFoldChange")
## Candidates
ll$candidate_list
#> $`0.01`
#> [1] 6 7 8 9 10 13 18
#>
#> $`0.05`
#> [1] 6 7 8 9 10 13 18
#>
#> $`0.1`
#> [1] 6 7 8 9 10 13 18
#>
#> $`0.25`
#> [1] 6 7 8 9 10 13 18
#>
#> $`0.75`
#> [1] 6 7 8 9 10 13 18
#>
## Score table
ll$score_data
#> node pvalue logFoldChange q_0.01 q_0.05 q_0.1 q_0.25 q_0.75
#> 1 1 7.774452e-04 1 1 1 1 1 1
#> 2 2 9.347052e-04 1 1 1 1 1 1
#> 3 3 2.121425e-04 1 1 1 1 1 1
#> 4 4 6.516738e-04 -1 -1 -1 -1 -1 -1
#> 5 5 1.255551e-04 -1 -1 -1 -1 -1 -1
#> 6 6 8.983897e-01 -1 0 0 0 0 0
#> 7 7 9.446753e-01 1 0 0 0 0 0
#> 8 8 6.607978e-01 -1 0 0 0 0 -1
#> 9 9 6.291140e-01 -1 0 0 0 0 -1
#> 10 10 6.178627e-02 1 0 0 1 1 1
#> 11 11 2.059746e-01 -1 0 0 0 -1 -1
#> 12 12 1.765568e-01 1 0 0 0 1 1
#> 13 13 2.672207e-04 1 1 1 1 1 1
#> 14 14 3.861141e-04 1 1 1 1 1 1
#> 15 15 7.698414e-01 1 0 0 0 0 0
#> 16 16 4.976992e-01 -1 0 0 0 0 -1
#> 17 17 7.176185e-01 1 0 0 0 0 1
#> 18 18 1.339033e-05 -1 -1 -1 -1 -1 -1
#> 19 19 3.800352e-01 1 0 0 0 0 1
## Simulate p-values and directions of change for nodes
## (Nodes 1, 2, 3, 4, 5, 13, 14, 18 have a true signal)
set.seed(1)
pv <- runif(19, 0, 1)
pv[c(seq_len(5), 13, 14, 18)] <- runif(8, 0, 0.001)
fc <- sample(c(-1, 1), 19, replace = TRUE)
fc[c(seq_len(3), 13, 14)] <- 1
fc[c(4, 5, 18)] <- -1
df <- data.frame(node = seq_len(19),
pvalue = pv,
logFoldChange = fc)
ll <- getCand(tree = tinyTree, score_data = df,
t = c(0.01, 0.05, 0.1, 0.25, 0.75),
node_column = "node", p_column = "pvalue",
sign_column = "logFoldChange")
## Candidates
ll$candidate_list
#> $`0.01`
#> [1] 6 7 8 9 10 13 18
#>
#> $`0.05`
#> [1] 6 7 8 9 10 13 18
#>
#> $`0.1`
#> [1] 6 7 8 9 10 13 18
#>
#> $`0.25`
#> [1] 6 7 8 9 10 13 18
#>
#> $`0.75`
#> [1] 6 7 8 9 10 13 18
#>
## Score table
ll$score_data
#> node pvalue logFoldChange q_0.01 q_0.05 q_0.1 q_0.25 q_0.75
#> 1 1 7.774452e-04 1 1 1 1 1 1
#> 2 2 9.347052e-04 1 1 1 1 1 1
#> 3 3 2.121425e-04 1 1 1 1 1 1
#> 4 4 6.516738e-04 -1 -1 -1 -1 -1 -1
#> 5 5 1.255551e-04 -1 -1 -1 -1 -1 -1
#> 6 6 8.983897e-01 -1 0 0 0 0 0
#> 7 7 9.446753e-01 1 0 0 0 0 0
#> 8 8 6.607978e-01 -1 0 0 0 0 -1
#> 9 9 6.291140e-01 -1 0 0 0 0 -1
#> 10 10 6.178627e-02 1 0 0 1 1 1
#> 11 11 2.059746e-01 -1 0 0 0 -1 -1
#> 12 12 1.765568e-01 1 0 0 0 1 1
#> 13 13 2.672207e-04 1 1 1 1 1 1
#> 14 14 3.861141e-04 1 1 1 1 1 1
#> 15 15 7.698414e-01 1 0 0 0 0 0
#> 16 16 4.976992e-01 -1 0 0 0 0 -1
#> 17 17 7.176185e-01 1 0 0 0 0 1
#> 18 18 1.339033e-05 -1 -1 -1 -1 -1 -1
#> 19 19 3.800352e-01 1 0 0 0 0 1