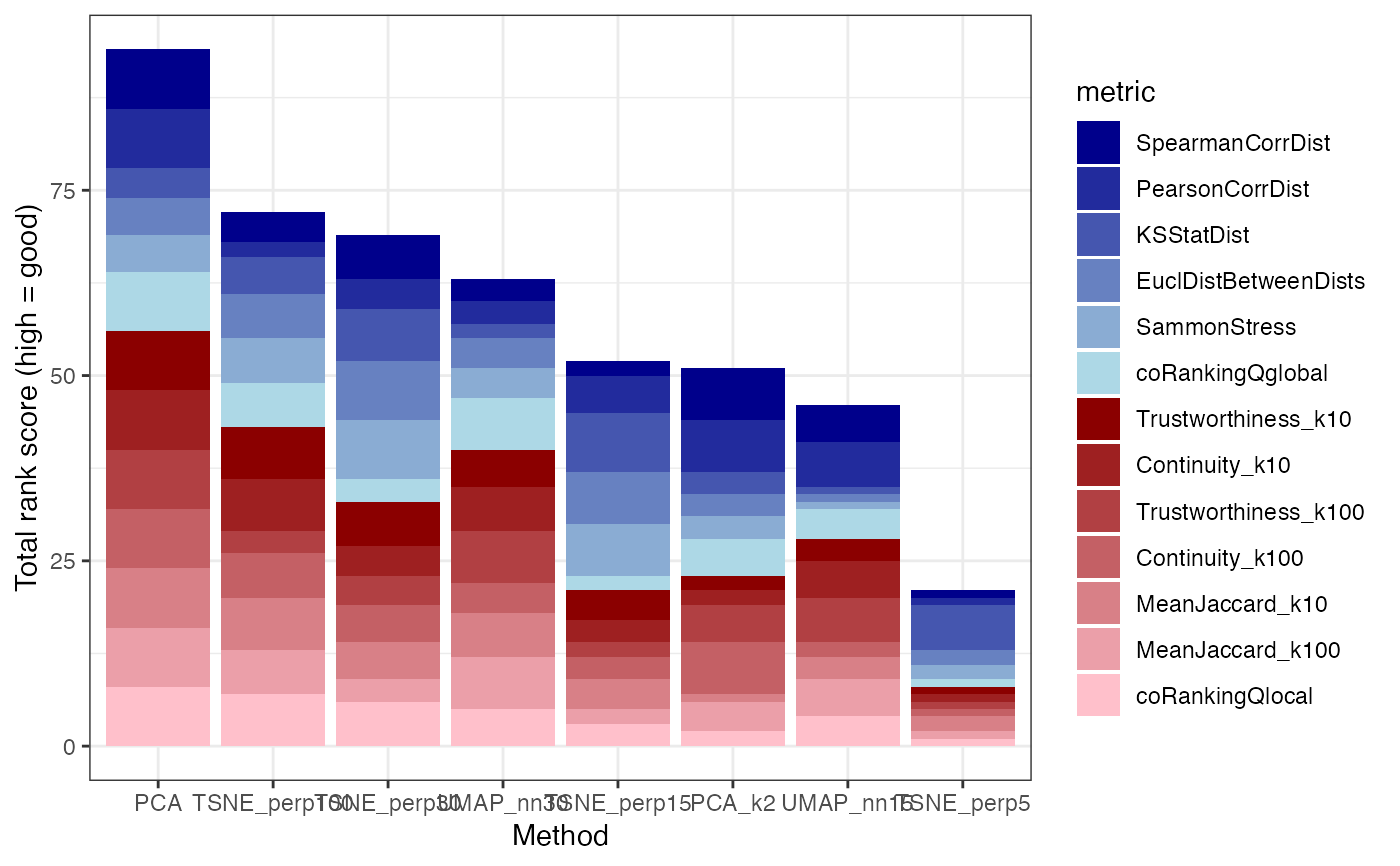
Plot summary of the dimension reduction method ranking across metrics
Source:R/plotting.R
plotRankSummary.RdFor each metric, rank the evaluated reduced dimension representations by performance, and plot a summary of the overall ranking. Metrics evaluating local and global structure preservations are colored in red and blue, respectively.
plotRankSummary(
  dreSummary,
  metrics = NULL,
  sortBars = "decreasing",
  scoreType = "rank",
  tiesMethod = "average"
)
Arguments
- dreSummary
A
data.framewith the values of the evaluation metrics, typically the"scores"element of the output ofdreval().- metrics
A character vector with the metrics to include in the summary. Must be a subset of the column names of
dreSummary. IfNULL, all metrics will be used. It can also be "global" or "local", in which case all the global or local metrics, respectively, will be used.- sortBars
A character scalar indicating whether/how to sort the bars in the output. Either "decreasing", "increasing" or "none" (in which case the input order will be used).
- scoreType
A character scalar indicating what type of values to show in the plot. Either "rank" or "rescale". If set to "rank", the representations will be ranked for each metric (with the best one assigned the highest rank). If set to "rescale", the scores for each metric will first, if necessary, be inverted so that a high (positive) value corresponds to better performance, and then be linearly rescaled, mapping the lowest score to 1 and the highest to P, where P is the number of evaluated representations. If the original scores are approximately equally spaced between the highest and lowest observed values, this gives similar results as setting
scoreTypeto "rank". However, if some of the scores are very similar to each other, the "rescale" approach allows them to get a similar rank score rather than forcing a uniform difference between successive scores.- tiesMethod
A character scalar indicating how ties are handled if
scoreTypeis "rank". Should be one of the values accepted bybase::rank("average", "first", "last", "random", "max", "min").
Value
Nothing is returned, but a plot is generated.
