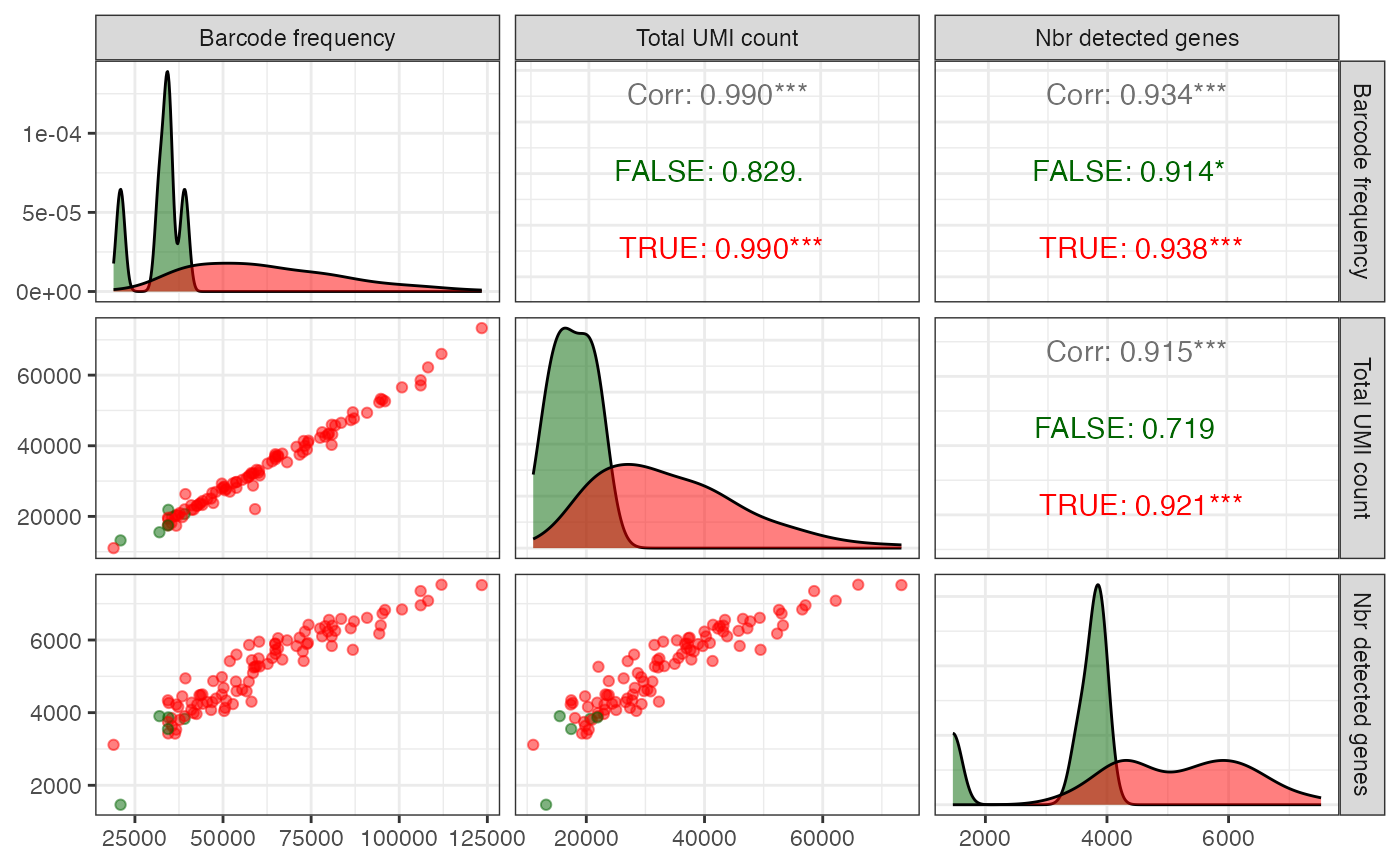
Pairs plot with quantification summary statistics
Source:R/plotAlevinQuantPairs.R
plotAlevinQuantPairs.RdPairs plot with quantification summary statistics
plotAlevinQuantPairs(
  cbTable,
  colName = "inFinalWhiteList",
  firstSelColName = "inFirstWhiteList"
)
Arguments
- cbTable
data.frame(such as thecbTablereturned byreadAlevinQCorreadAlevinFryQC) with collapsed barcode frequencies, the total UMI count and the number of detected genes for each cell.- colName
Character scalar giving the name of a logical column of
cbTableto use for coloring the points.- firstSelColName
Character scalar indicating the name of the logical column in
cbTablethat corresponds to the original selection of barcodes for quantification.
Value
A ggmatrix object
Examples
alevin <- readAlevinQC(system.file("extdata/alevin_example_v0.14",
                                   package = "alevinQC"))
plotAlevinQuantPairs(alevin$cbTable, colName = "inFinalWhiteList")