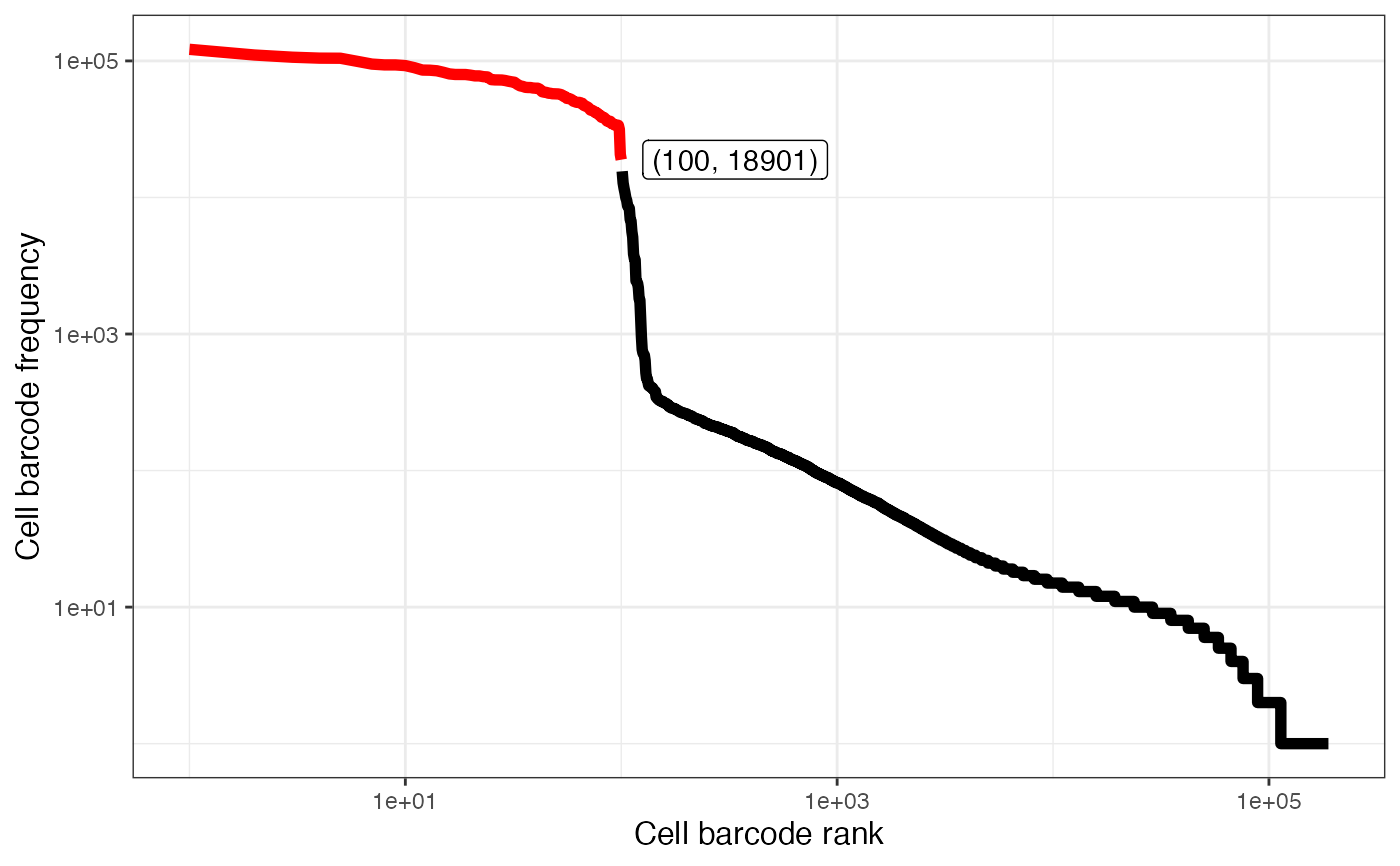
Plot the raw cell barcode frequencies in decreasing order, and indicate a predetermined breakpoint (indicating barcodes included in the original whitelist) using color as well as a label.
plotAlevinKneeRaw(cbTable, firstSelColName = "inFirstWhiteList")Arguments
Value
A ggplot object
Examples
alevin <- readAlevinQC(system.file("extdata/alevin_example_v0.14",
                                   package = "alevinQC"))
plotAlevinKneeRaw(alevin$cbTable)