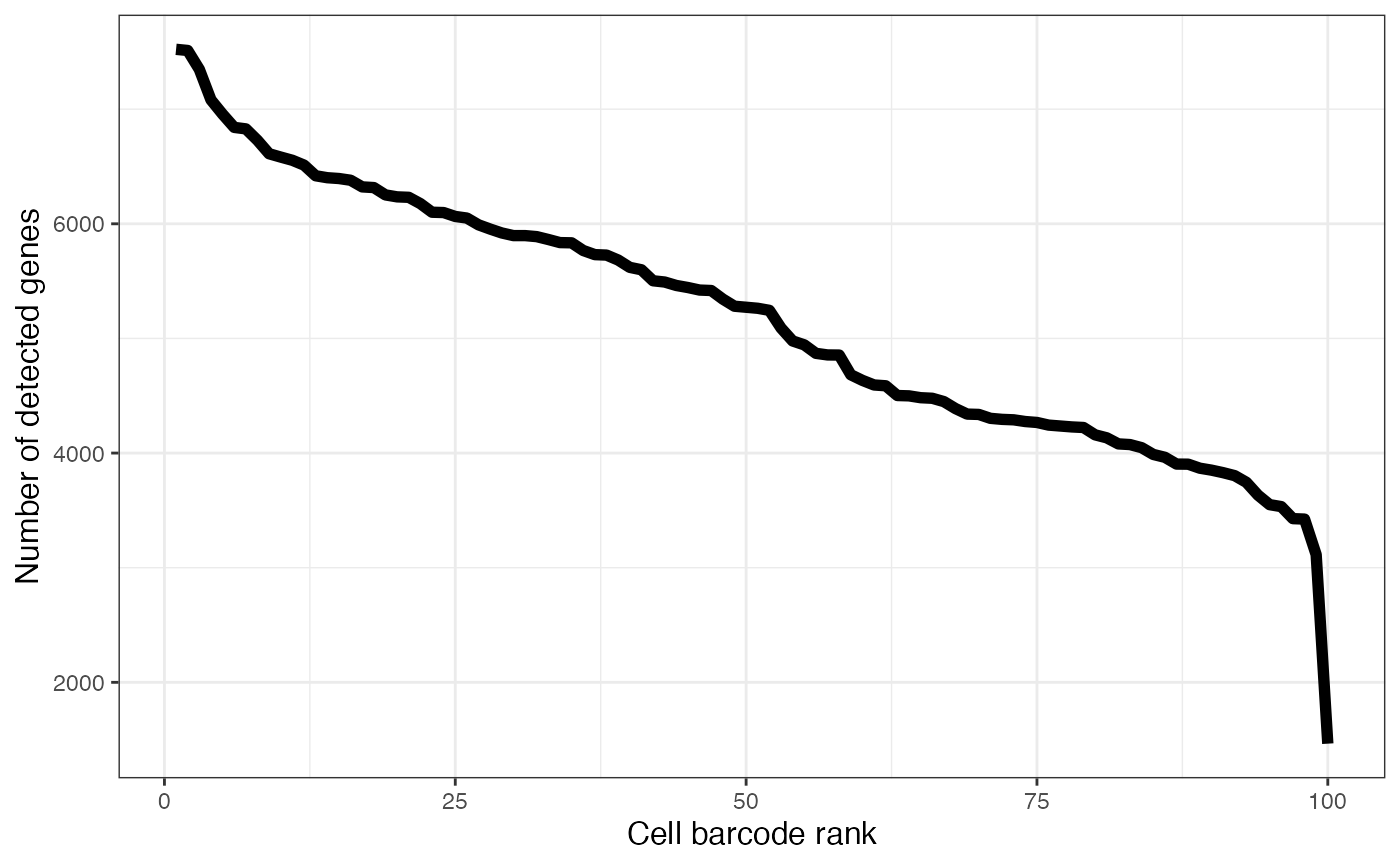
Knee plot of the number of detected genes per cell
Source:R/plotAlevinKneeNbrGenes.R
plotAlevinKneeNbrGenes.RdPlot the number of detected genes per cell in decreasing order. Only cells contained in the original whitelist are considered.
plotAlevinKneeNbrGenes(cbTable, firstSelColName = "inFirstWhiteList")Arguments
Value
A ggplot object
Examples
alevin <- readAlevinQC(system.file("extdata/alevin_example_v0.14",
                                   package = "alevinQC"))
plotAlevinKneeNbrGenes(alevin$cbTable)