Summary plot of cell barcode collapsing
Source:R/plotAlevinBarcodeCollapse.R
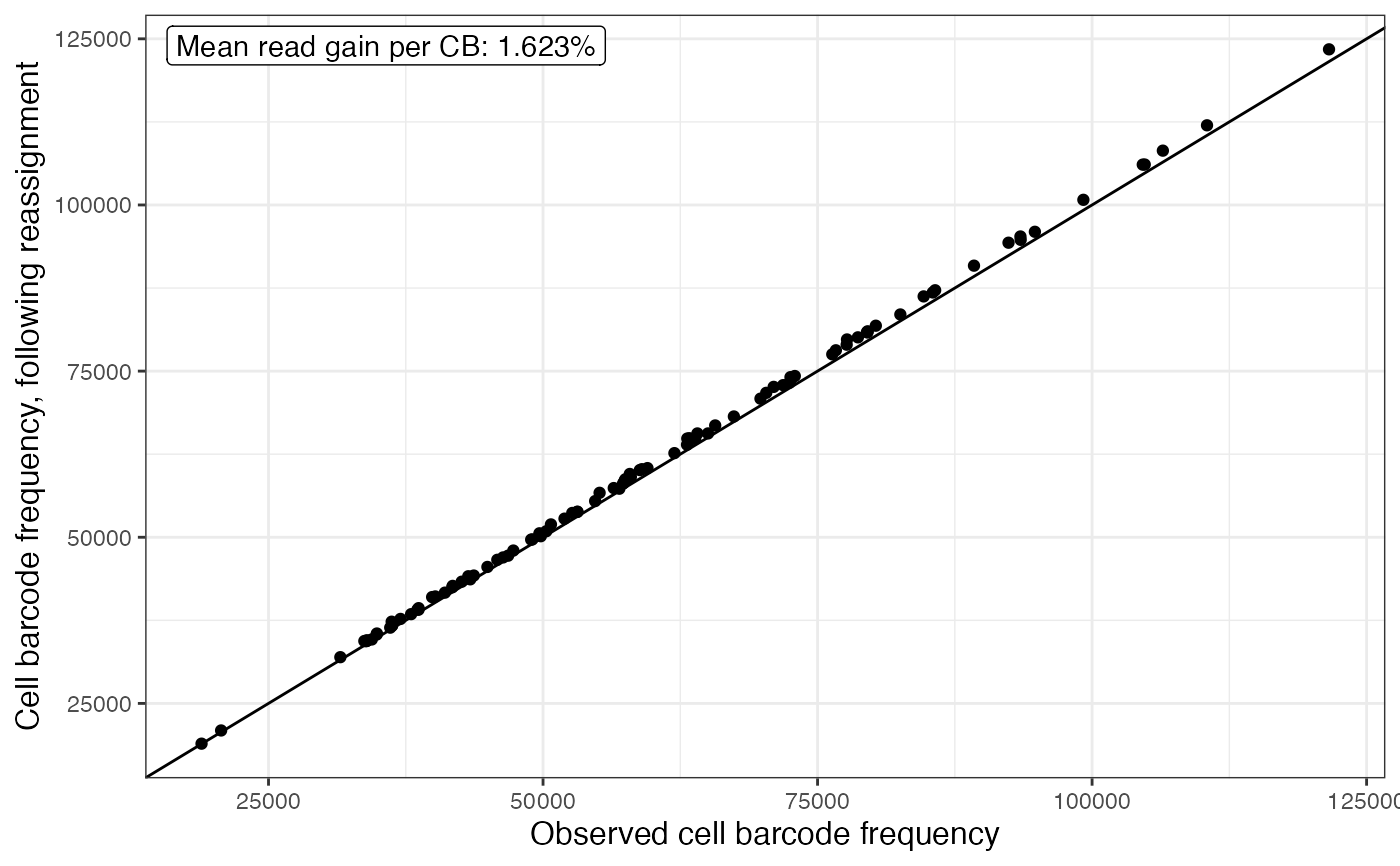
plotAlevinBarcodeCollapse.RdPlot the original frequency of each cell barcode in the original whitelist against the frequency after collapsing similar cell barcodes.
plotAlevinBarcodeCollapse(
  cbTable,
  firstSelColName = "inFirstWhiteList",
  countCol = "collapsedFreq"
)
Arguments
- cbTable
data.frame(such as thecbTablereturned byreadAlevinQCorreadAlevinFryQC) with barcode frequencies before and after collapsing.- firstSelColName
Character scalar indicating the name of the logical column in
cbTablethat corresponds to the original selection of barcodes for quantification.- countCol
Character scalar indicating the name of the column in
cbTablethat corresponds to the collapsed barcode frequencies.
Value
A ggplot object
Examples
alevin <- readAlevinQC(system.file("extdata/alevin_example_v0.14",
                                   package = "alevinQC"))
plotAlevinBarcodeCollapse(alevin$cbTable)