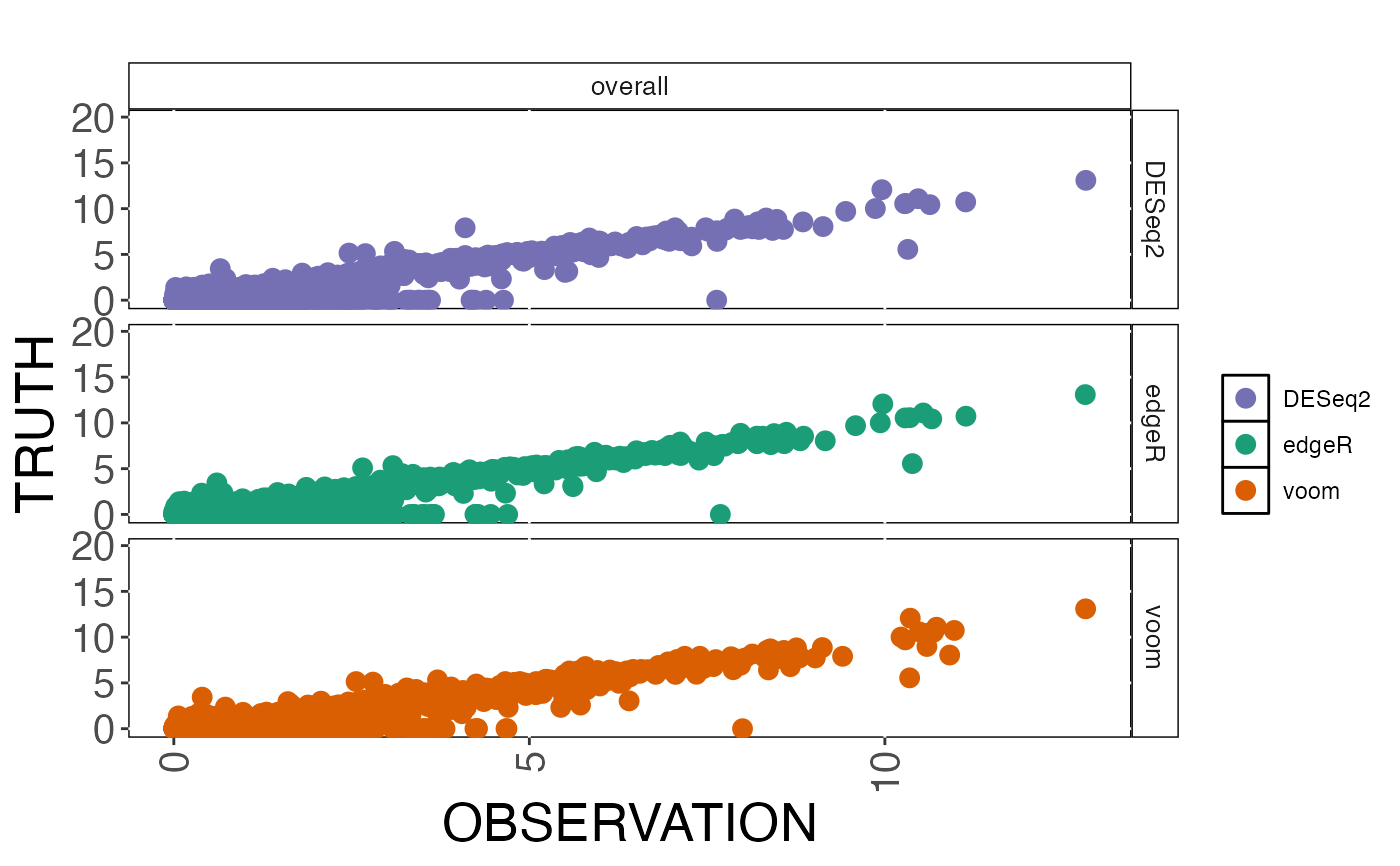
Plot scatter plots, indicating the relationship between observed values and a continuous truth.
Usage
plot_scatter(
  cobraplot,
  title = "",
  stripsize = 10,
  titlecol = "black",
  pointsize = 3,
  doflip = FALSE,
  dolog = FALSE
)
Arguments
- cobraplot
A
COBRAPlotobject.- title
A character string giving the title of the plot.
- stripsize
A numeric value giving the size of the strip text, when the results are stratified by an annotation.
- titlecol
A character string giving the color of the title.
- pointsize
A numeric value giving the size of the plot characters.
- doflip
A logical indicating whether to flip the axes when results are stratified by an annotation. By default (
doflip = FALSE), stratification levels are shown as columns and methods as rows in the plot.- dolog
A logical indicating whether to log10-transform values before plotting.
Examples
data(cobradata_example)
cobraperf <- calculate_performance(cobradata_example, cont_truth = "logFC",
                                   aspects = "scatter")
#> Warning: Object doesn't have a slot sval. Please run update_cobradata(). For consistency, I will return an empty data.frame
cobraplot <- prepare_data_for_plot(cobraperf, colorscheme = "Dark2",
                                   incltruth = TRUE)
plot_scatter(cobraplot)
#> Warning: Removed 4377 rows containing missing values or values outside the scale range
#> (`geom_point()`).