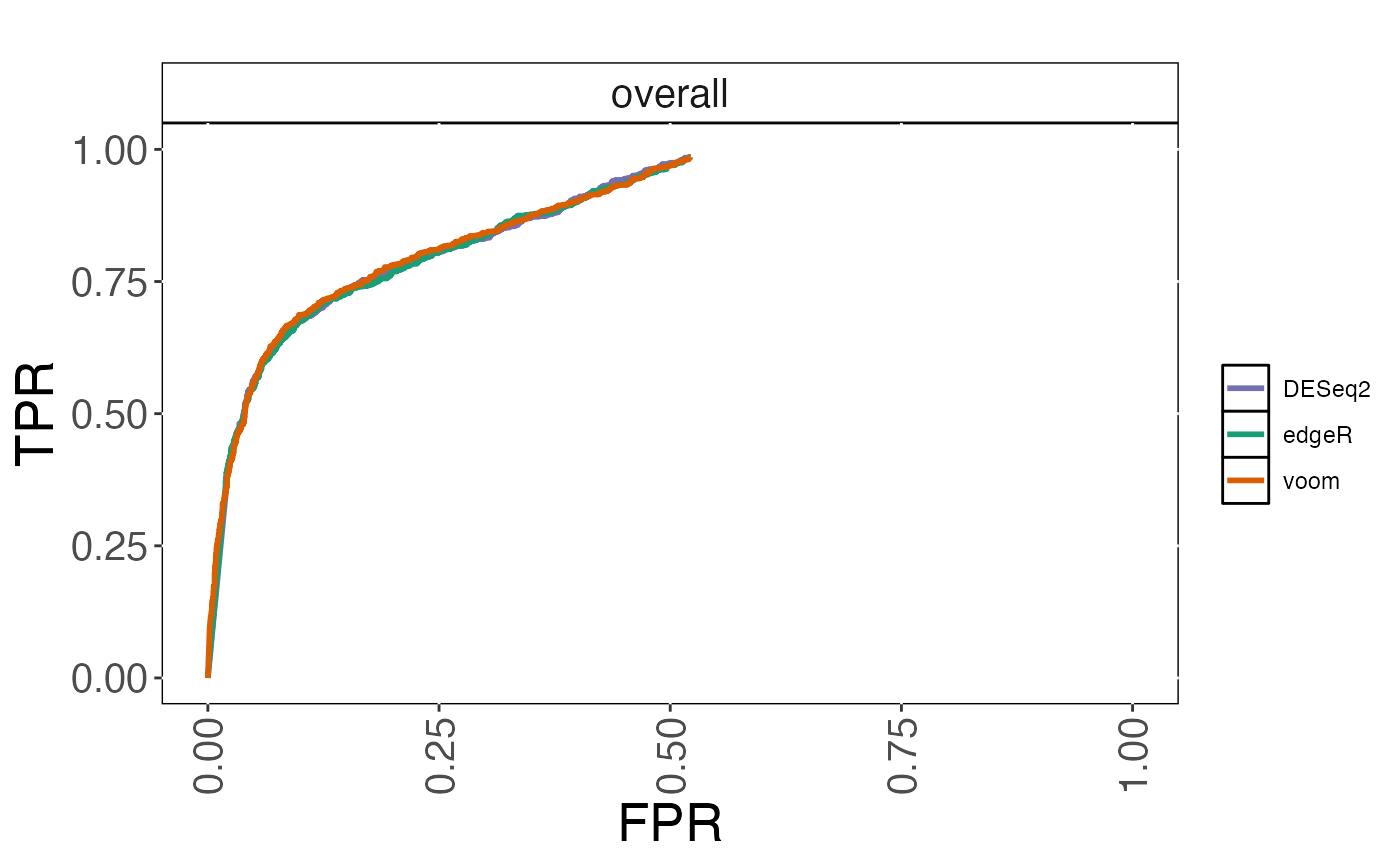
Plot receiver operating characteristics (ROC) curves.
Arguments
- cobraplot
A
COBRAPlotobject.- title
A character string giving the title of the plot.
- stripsize
A numeric value giving the size of the strip text, when the results are stratified by an annotation.
- titlecol
A character string giving the color of the title.
- xaxisrange
A numeric vector with two elements, giving the lower and upper boundary of the x-axis, respectively.
- yaxisrange
A numeric vector with two elements, giving the lower and upper boundary of the y-axis, respectively.
- linewidth
The line width used for plotting
Examples
data(cobradata_example)
cobraperf <- calculate_performance(cobradata_example,
                                   binary_truth = "status", aspects = "roc")
#> Warning: Object doesn't have a slot sval. Please run update_cobradata(). For consistency, I will return an empty data.frame
cobraplot <- prepare_data_for_plot(cobraperf, colorscheme = "Dark2",
                                   incltruth = TRUE)
plot_roc(cobraplot)