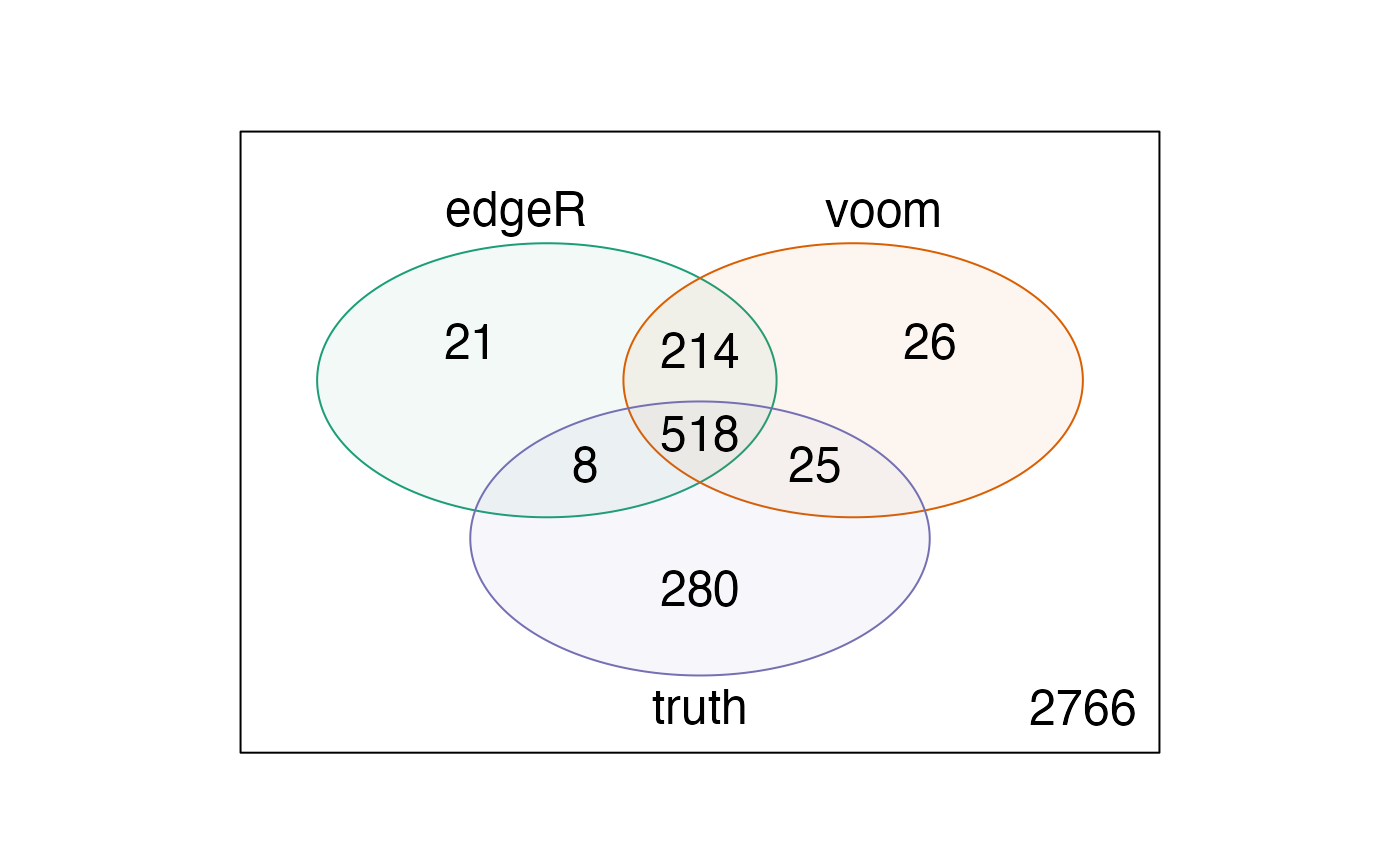
Plot a Venn diagram showing the overlaps among sets of significant feature
for a given adjusted p-value threshold (see thr_venn argument of
calculate_performance). Optionally, the truth can be included
as a "perfect" method. Note that maximally five methods (including the truth,
if applicable) can be compared.
Arguments
- cobraplot
A
COBRAPlotobject.- ...
Additional arguments to
limma::vennDiagram.
Examples
data(cobradata_example)
cobraperf <- calculate_performance(cobradata_example,
                                   binary_truth = "status",
                                   aspects = "overlap")
#> Warning: Object doesn't have a slot sval. Please run update_cobradata(). For consistency, I will return an empty data.frame
cobraplot <- prepare_data_for_plot(cobraperf, colorscheme = "Dark2",
                                   incltruth = TRUE)
plot_overlap(cobraplot)