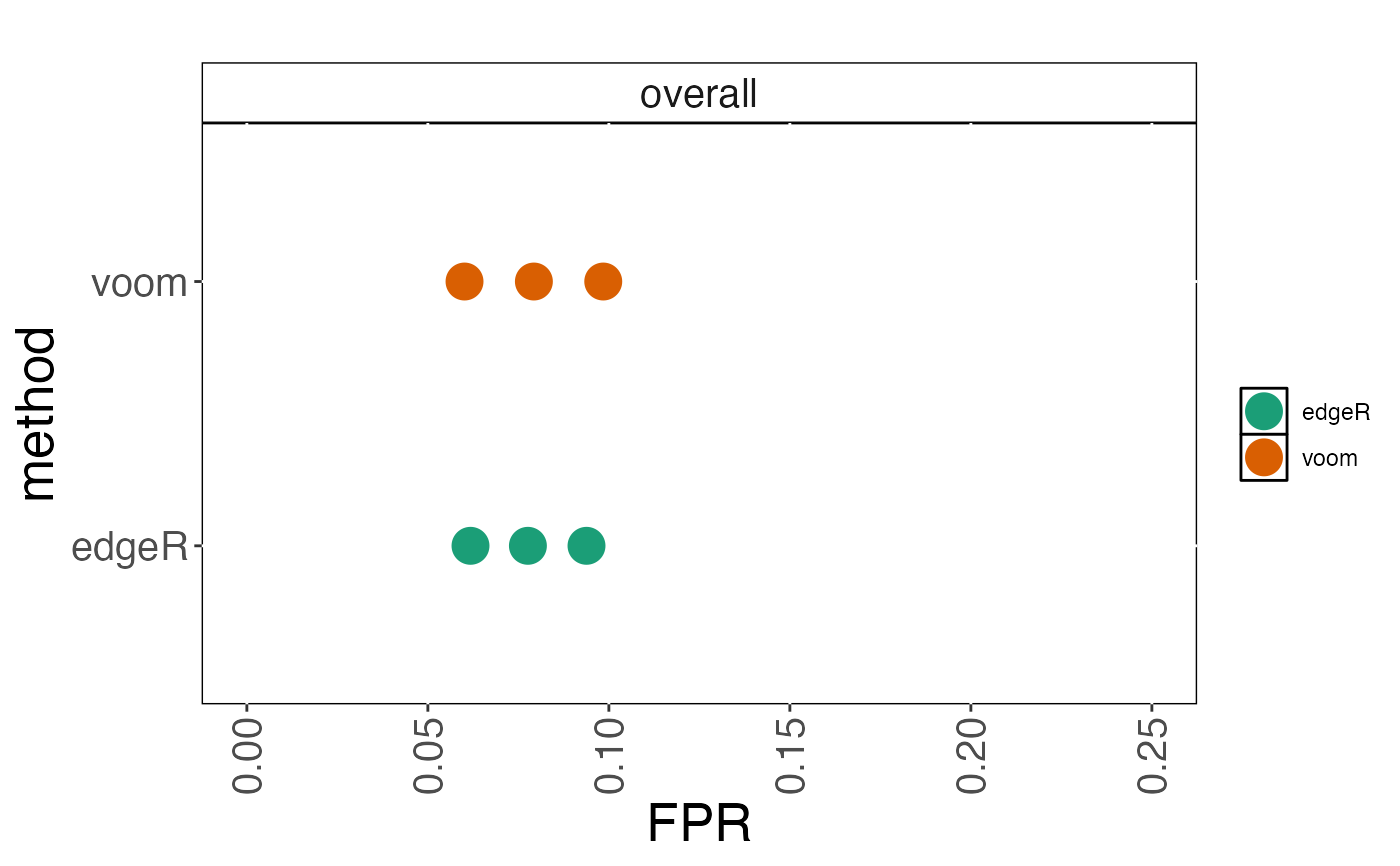
Plot observed false positive rate (FPR) for given adjusted p-value thresholds.
Usage
plot_fpr(
  cobraplot,
  title = "",
  stripsize = 15,
  titlecol = "black",
  pointsize = 5,
  xaxisrange = c(0, 1)
)
Arguments
- cobraplot
A
COBRAPlotobject.- title
A character string giving the title of the plot.
- stripsize
A numeric value giving the size of the strip text, when the results are stratified by an annotation.
- titlecol
A character string giving the color of the title.
- pointsize
A numeric value giving the size of the plot characters.
- xaxisrange
A numeric vector with two elements, giving the lower and upper boundary of the x-axis, respectively.
Examples
data(cobradata_example)
cobraperf <- calculate_performance(cobradata_example,
                                   binary_truth = "status", aspects = "fpr")
#> Warning: Object doesn't have a slot sval. Please run update_cobradata(). For consistency, I will return an empty data.frame
#> column DESeq2 is being ignored for NBRS calculations
#> column DESeq2 is being ignored for FPR calculations
cobraplot <- prepare_data_for_plot(cobraperf, colorscheme = "Dark2",
                                   incltruth = TRUE)
plot_fpr(cobraplot, xaxisrange = c(0, 0.25))