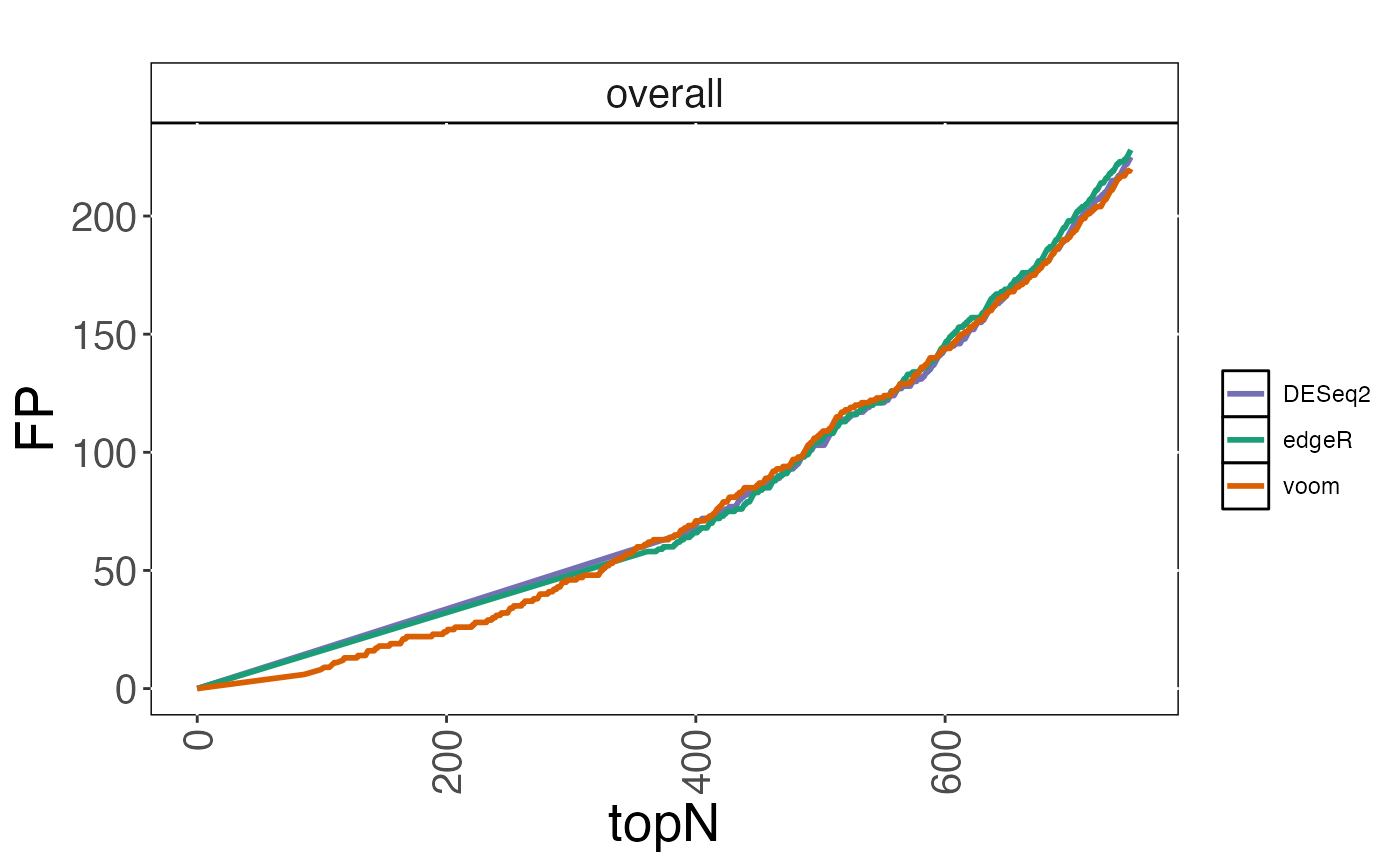
Plot false positive curves, indicating the number of false positives among the top-ranked N variables, for varying values of N.
Usage
plot_fpc(
  cobraplot,
  title = "",
  stripsize = 15,
  titlecol = "black",
  maxnfdc = 500,
  linewidth = 1
)
Arguments
- cobraplot
A
COBRAPlotobject.- title
A character string giving the title of the plot.
- stripsize
A numeric value giving the size of the strip text, when the results are stratified by an annotation.
- titlecol
A character string giving the color of the title.
- maxnfdc
A numeric value giving the largest N to consider.
- linewidth
The line width used for plotting
Examples
data(cobradata_example)
cobraperf <- calculate_performance(cobradata_example,
                                   binary_truth = "status", aspects = "fpc")
#> Warning: Object doesn't have a slot sval. Please run update_cobradata(). For consistency, I will return an empty data.frame
cobraplot <- prepare_data_for_plot(cobraperf, colorscheme = "Dark2",
                                   incltruth = TRUE)
plot_fpc(cobraplot, maxnfdc = 750)
#> Warning: Removed 4946 rows containing missing values or values outside the scale range
#> (`geom_path()`).