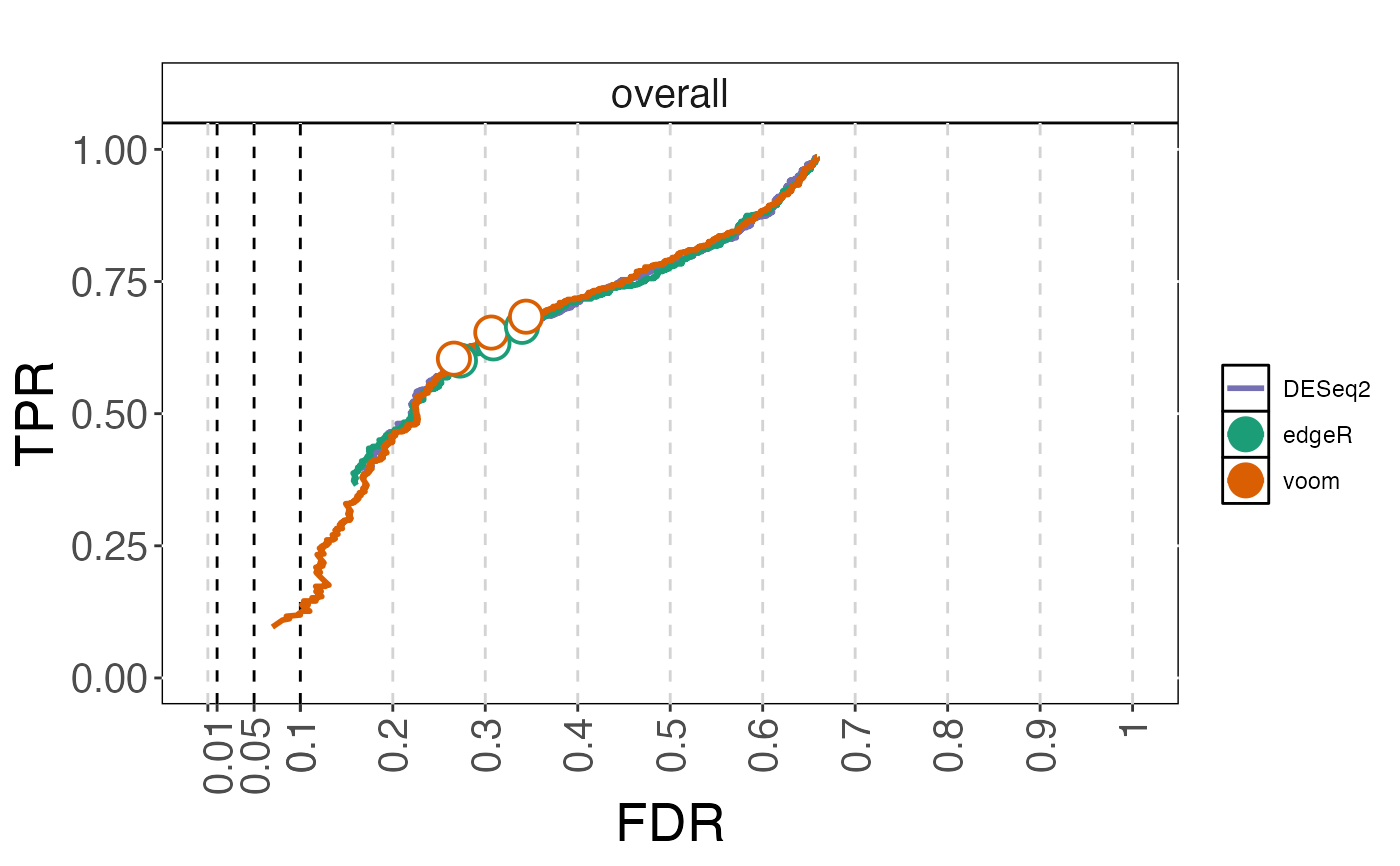
Plot observed true positive rate (TPR) vs observed false discovery rate (FDR), for given adjusted p-value thresholds and/or as curves traced out by considering all threshold values.
Arguments
- cobraplot
A
COBRAPlotobject.- title
A character string giving the title of the plot.
- stripsize
A numeric value giving the size of the strip text, when the results are stratified by an annotation.
- titlecol
A character string giving the color of the title.
- pointsize
A numeric value giving the size of the plot characters.
- xaxisrange
A numeric vector with two elements, giving the lower and upper boundary of the x-axis, respectively.
- yaxisrange
A numeric vector with two elements, giving the lower and upper boundary of the y-axis, respectively.
- plottype
A character vector giving the type of plot to construct. Can be any combination of the two elements "curve" and "points".
- linewidth
The line width used for plotting
Examples
data(cobradata_example)
cobraperf <- calculate_performance(cobradata_example,
                                   binary_truth = "status",
                                   aspects = c("fdrtpr", "fdrtprcurve"))
#> Warning: Object doesn't have a slot sval. Please run update_cobradata(). For consistency, I will return an empty data.frame
#> column DESeq2 is being ignored for NBRS calculations
#> column DESeq2 is being ignored for TPR calculations
#> column DESeq2 is being ignored for FDR calculations
cobraplot <- prepare_data_for_plot(cobraperf, colorscheme = "Dark2",
                                   incltruth = TRUE)
plot_fdrtprcurve(cobraplot, plottype = c("curve", "points"))
#> Warning: Removed 3 rows containing missing values or values outside the scale range
#> (`geom_path()`).