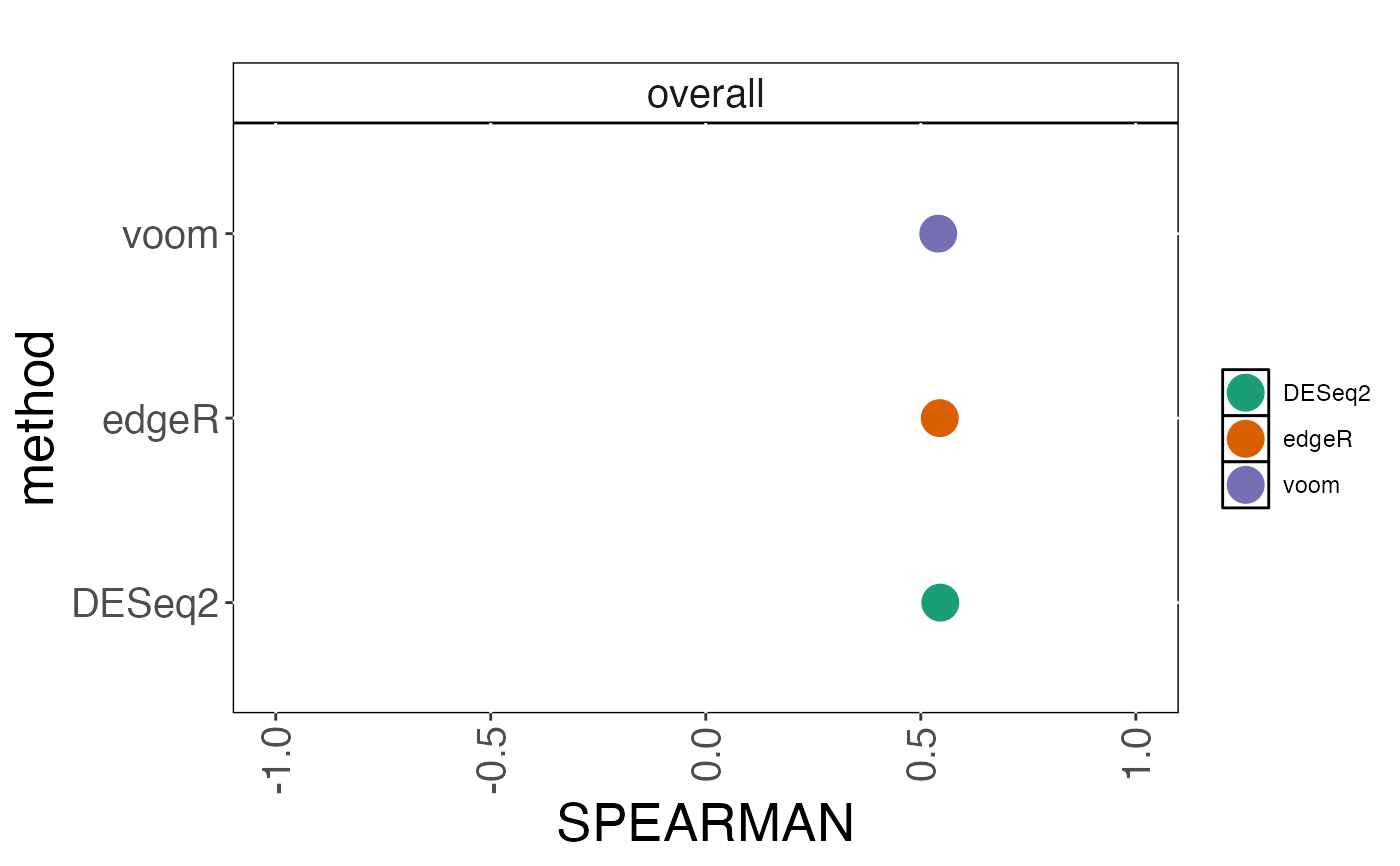
Plot correlations between observations and a continuous truth value.
Usage
plot_corr(
  cobraplot,
  title = "",
  stripsize = 15,
  titlecol = "black",
  pointsize = 5,
  xaxisrange = c(-1, 1),
  corrtype = "pearson"
)
Arguments
- cobraplot
A
COBRAPlotobject.- title
A character string giving the title of the plot.
- stripsize
A numeric value giving the size of the strip text, when the results are stratified by an annotation.
- titlecol
A character string giving the color of the title.
- pointsize
A numeric value giving the size of the plot characters.
- xaxisrange
A numeric vector with two elements, giving the lower and upper boundary of the x-axis, respectively.
- corrtype
A character string giving the type of correlation to show. Either "pearson" or "spearman".
Examples
data(cobradata_example)
cobraperf <- calculate_performance(cobradata_example, cont_truth = "logFC",
                                   aspects = "corr")
#> Warning: Object doesn't have a slot sval. Please run update_cobradata(). For consistency, I will return an empty data.frame
cobraplot <- prepare_data_for_plot(cobraperf, colorscheme = "Dark2",
                                   incltruth = TRUE)
plot_corr(cobraplot, corrtype = "spearman")